1
2
3
4
5
6
7
8
9
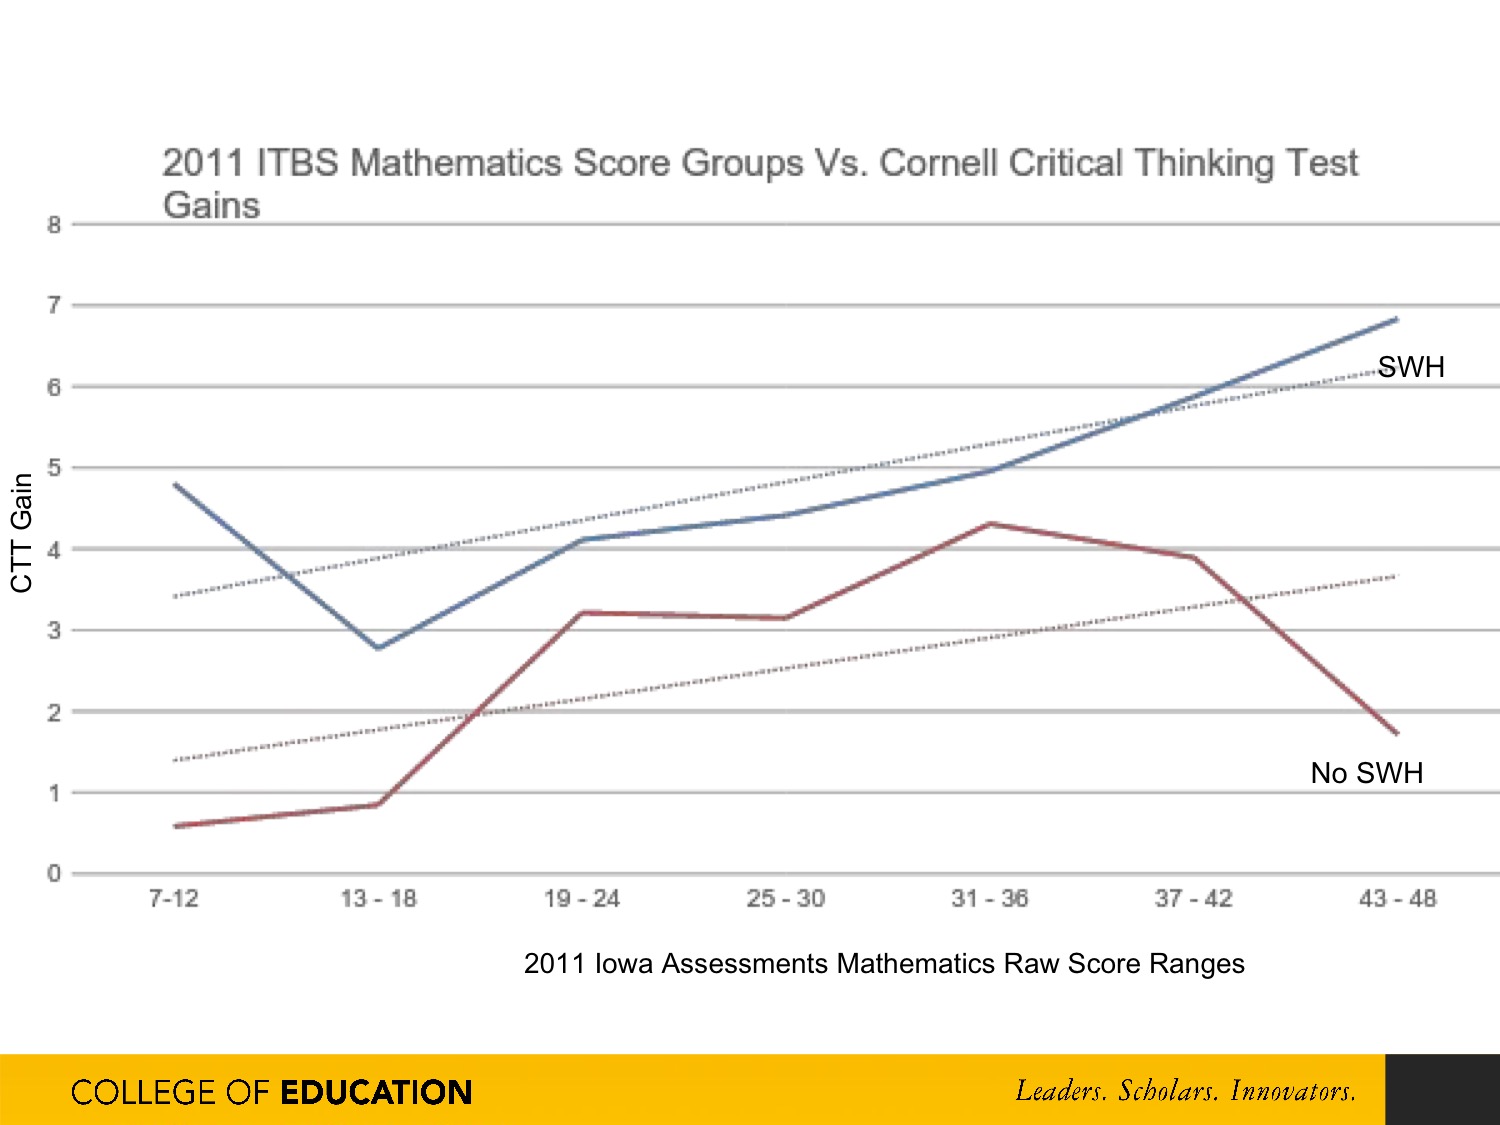
For Mathematics the effect of the SWH approach is associated with a statistically significant 2.06 point increase per year, with effect size of 0.14.This represents a 12.01% greater annual increase for the treatment group compared to the control group in Mathematics. The number of observations in the model for Mathematics includes 28,372 measures, for 15,388 students, across 48 randomization units.
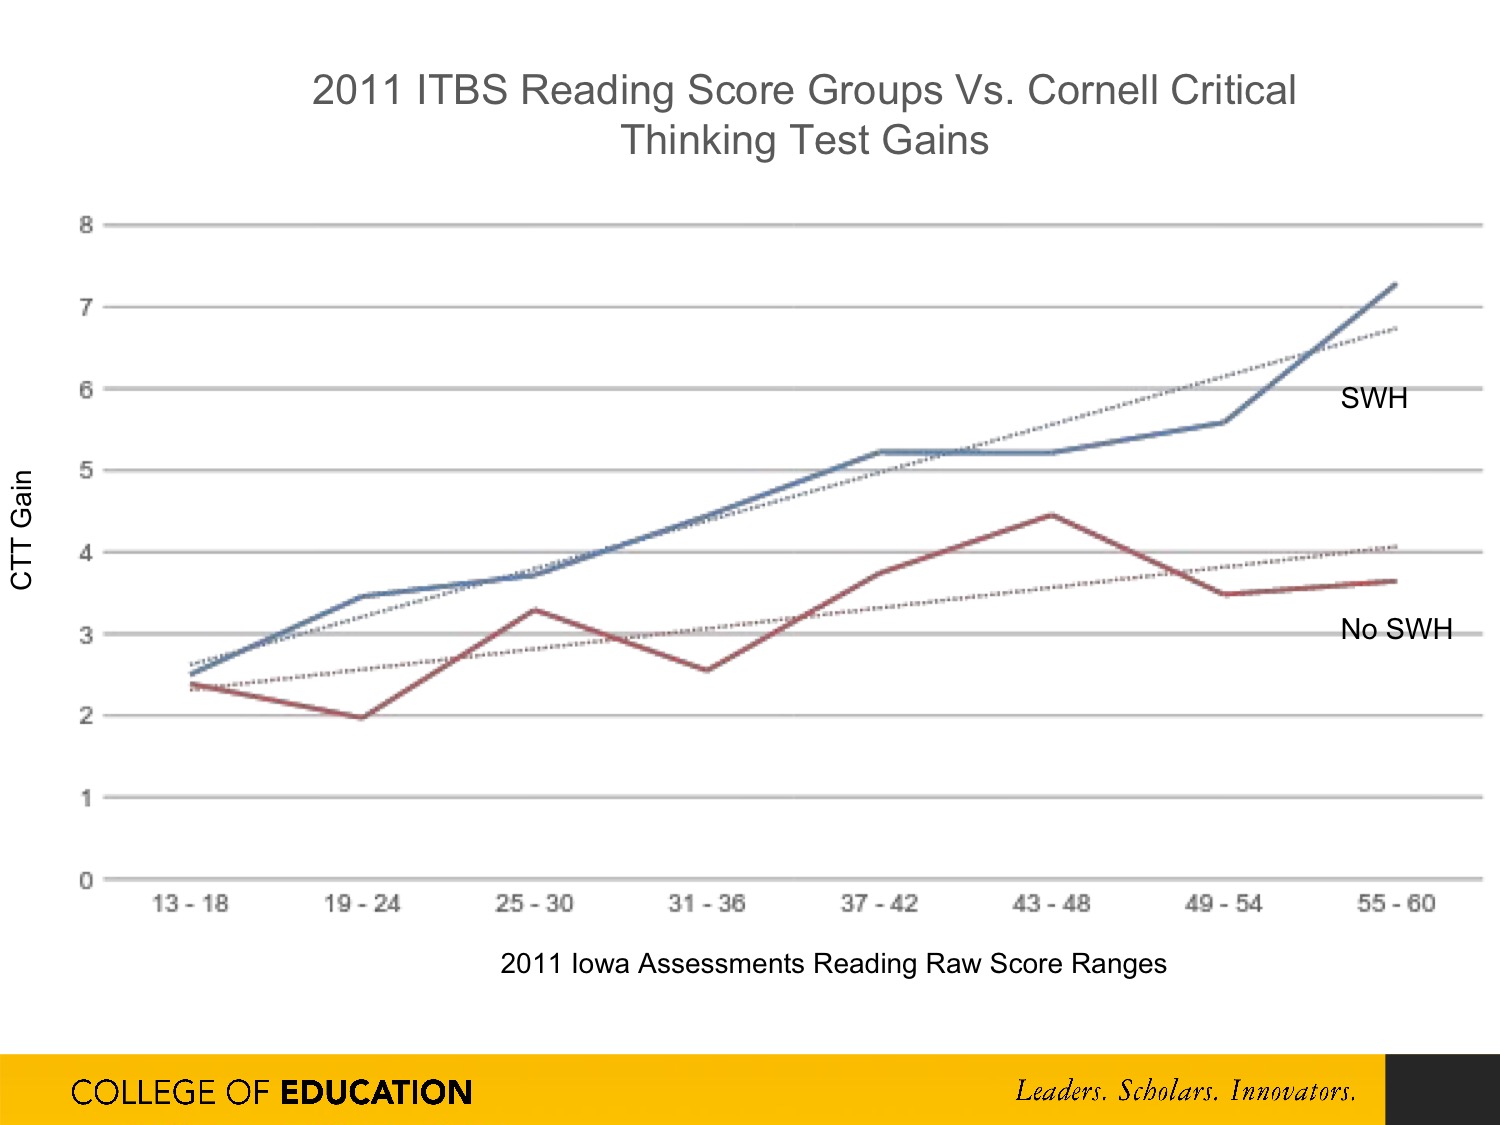
For Reading Comprehension the effect of the SWH approach is associated with a statistically significant 1.53 point increase per year, with effect size of 0.09. This represents a 9.68% greater annual increase for the treatment group compared to the control group in Reading Comprehension. The number of observations in the model for Reading Comprehension includes 28,389 measures, for 15,351 students, across 48 randomization units.
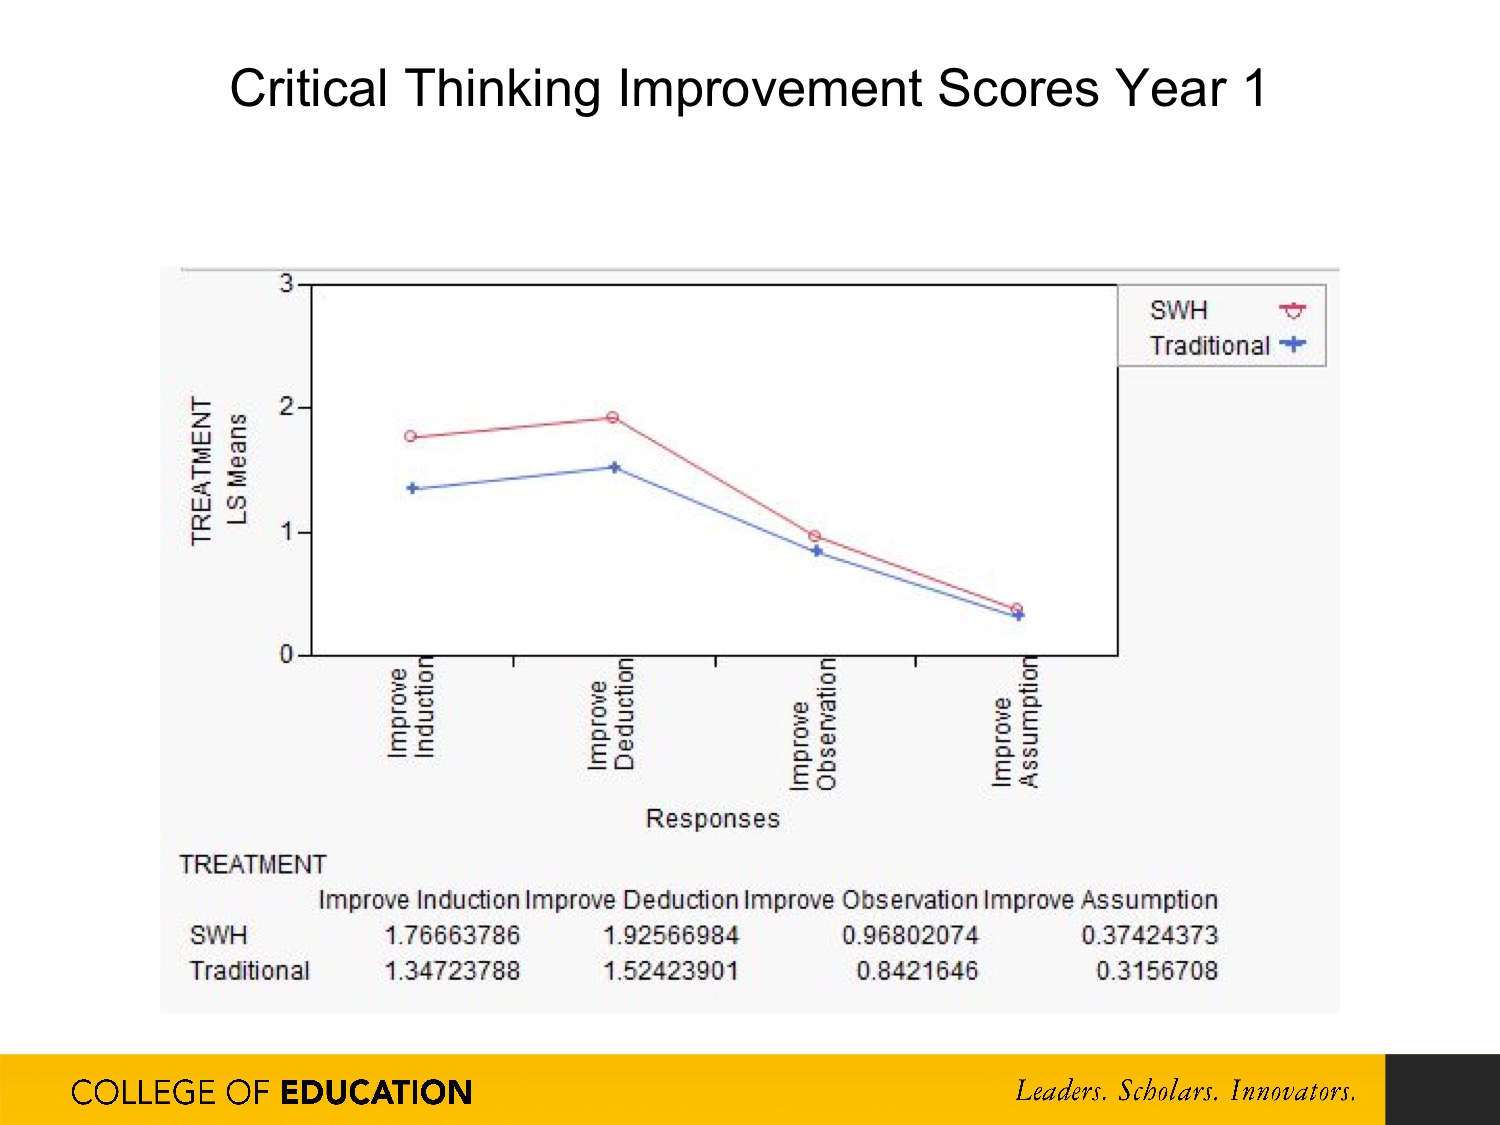
This chart shows the average growth of critical thinking skills for SWH students vs students in a traditional science classroom for year 1 of the study
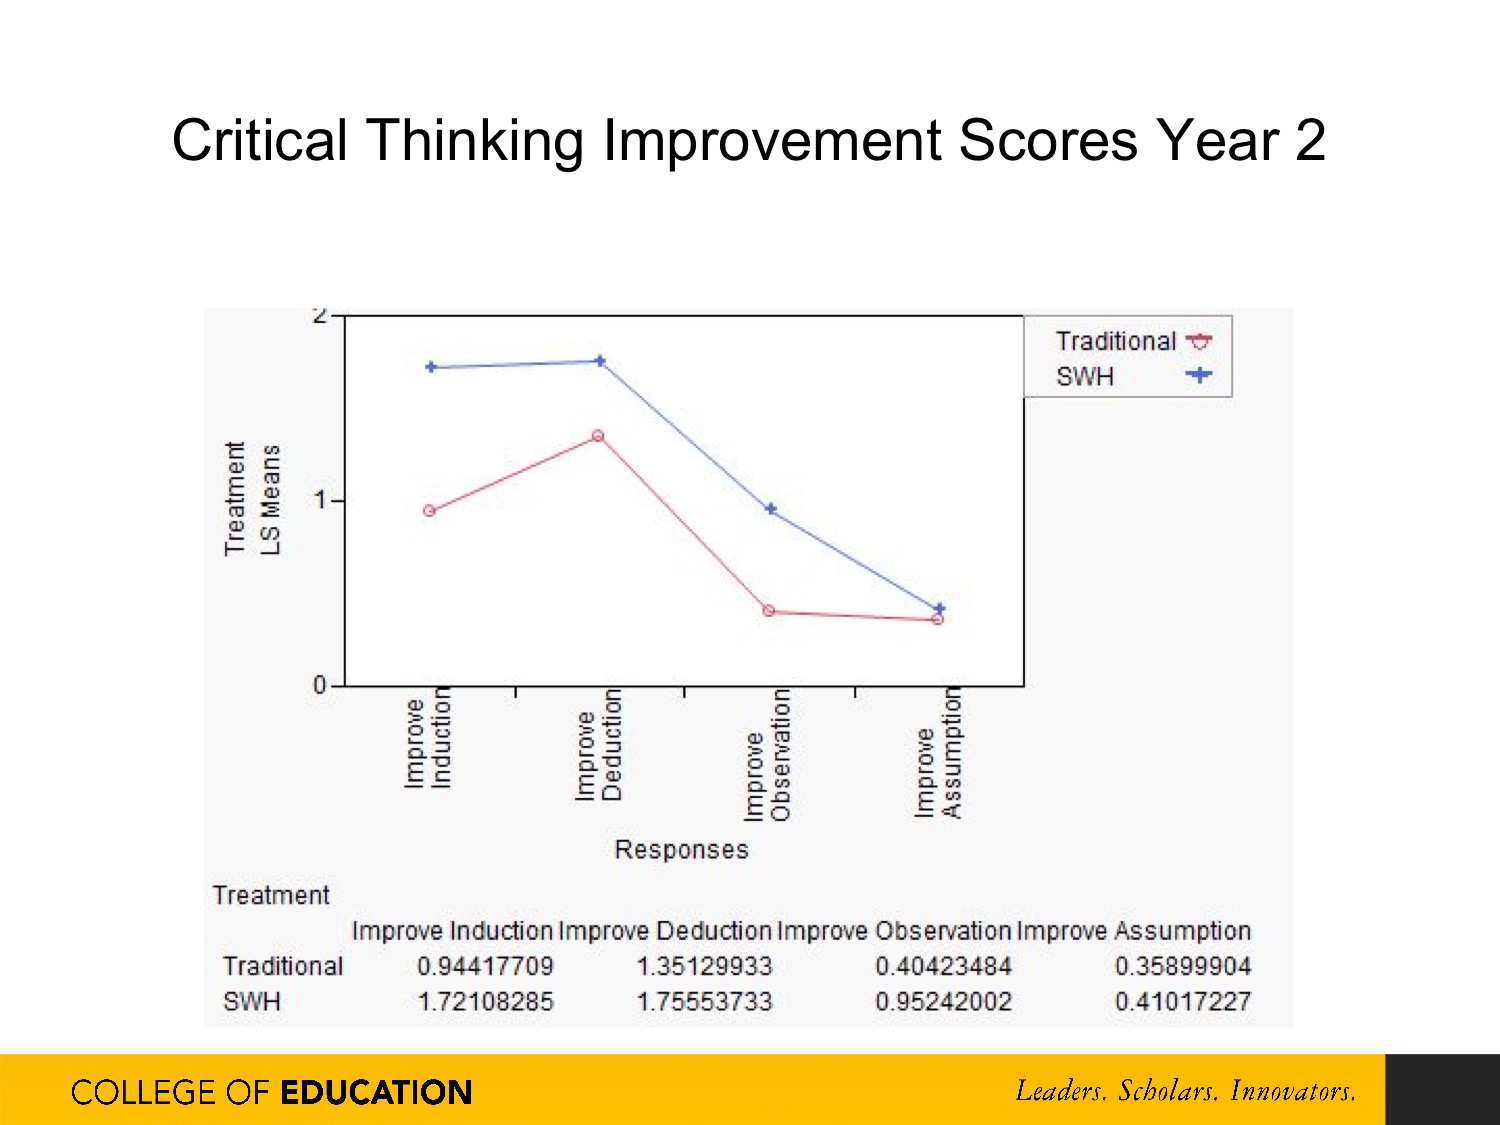
This chart shows the average growth of critical thinking skills for SWH students vs students in a traditional science classroom for year 2 of the study
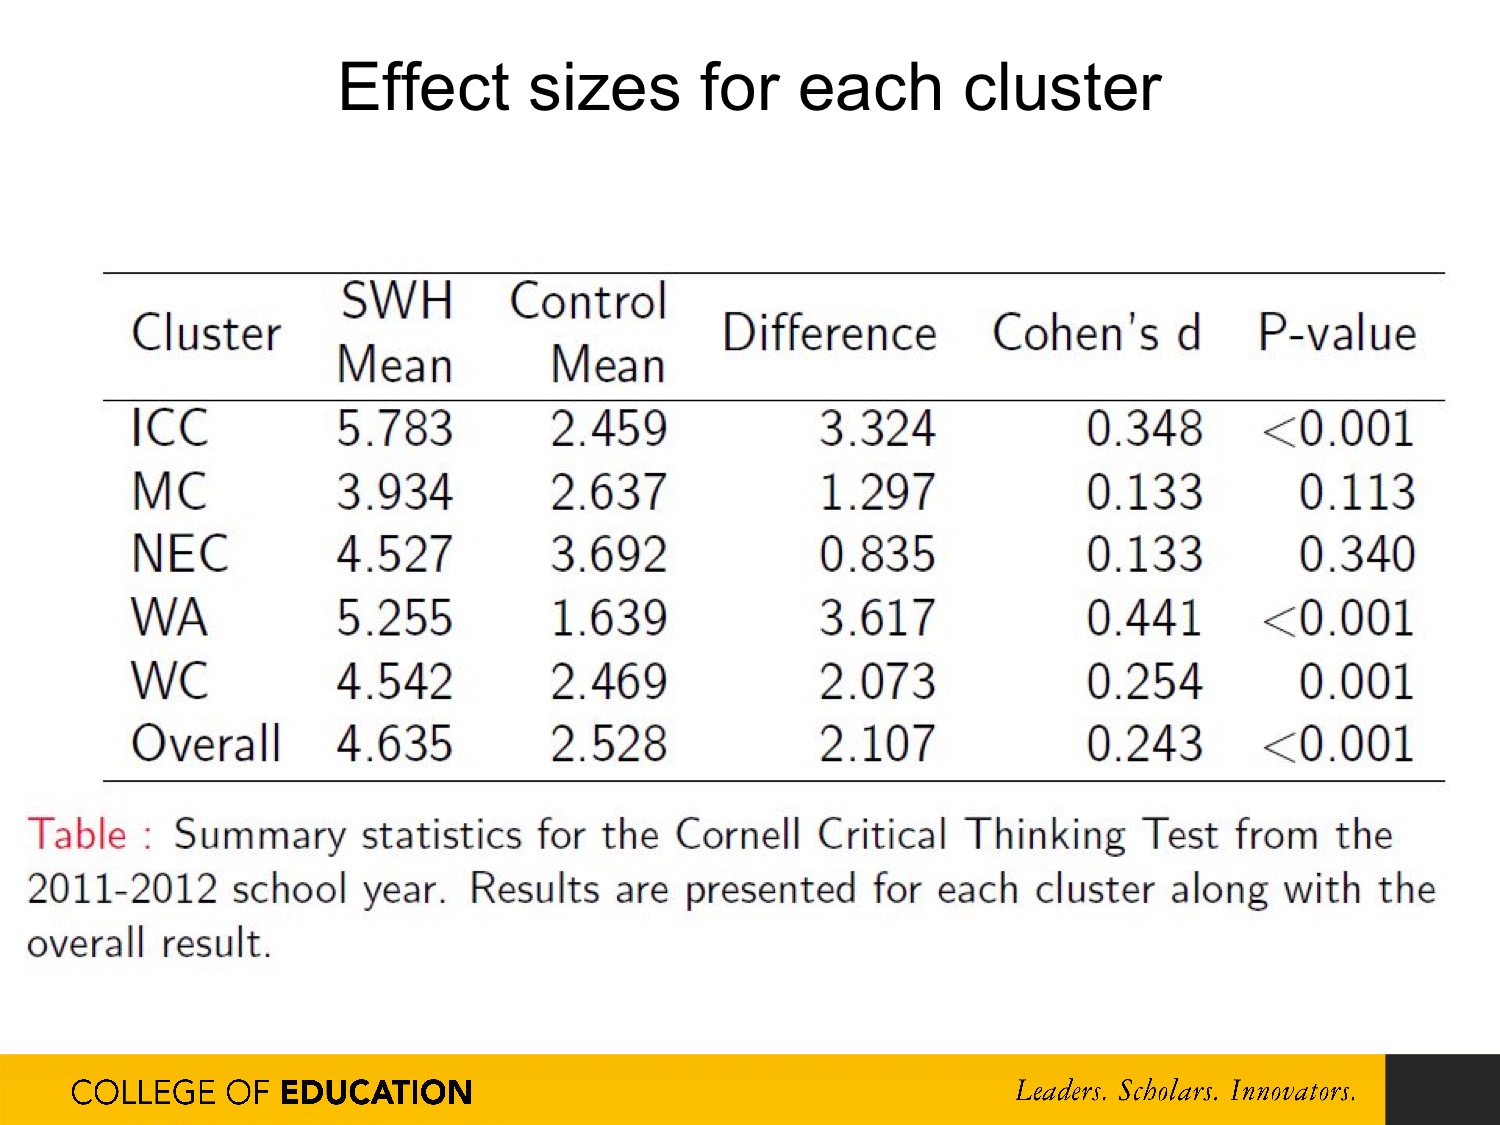
This table shows a break down of effect sizes based on which training region the classroom was part of.
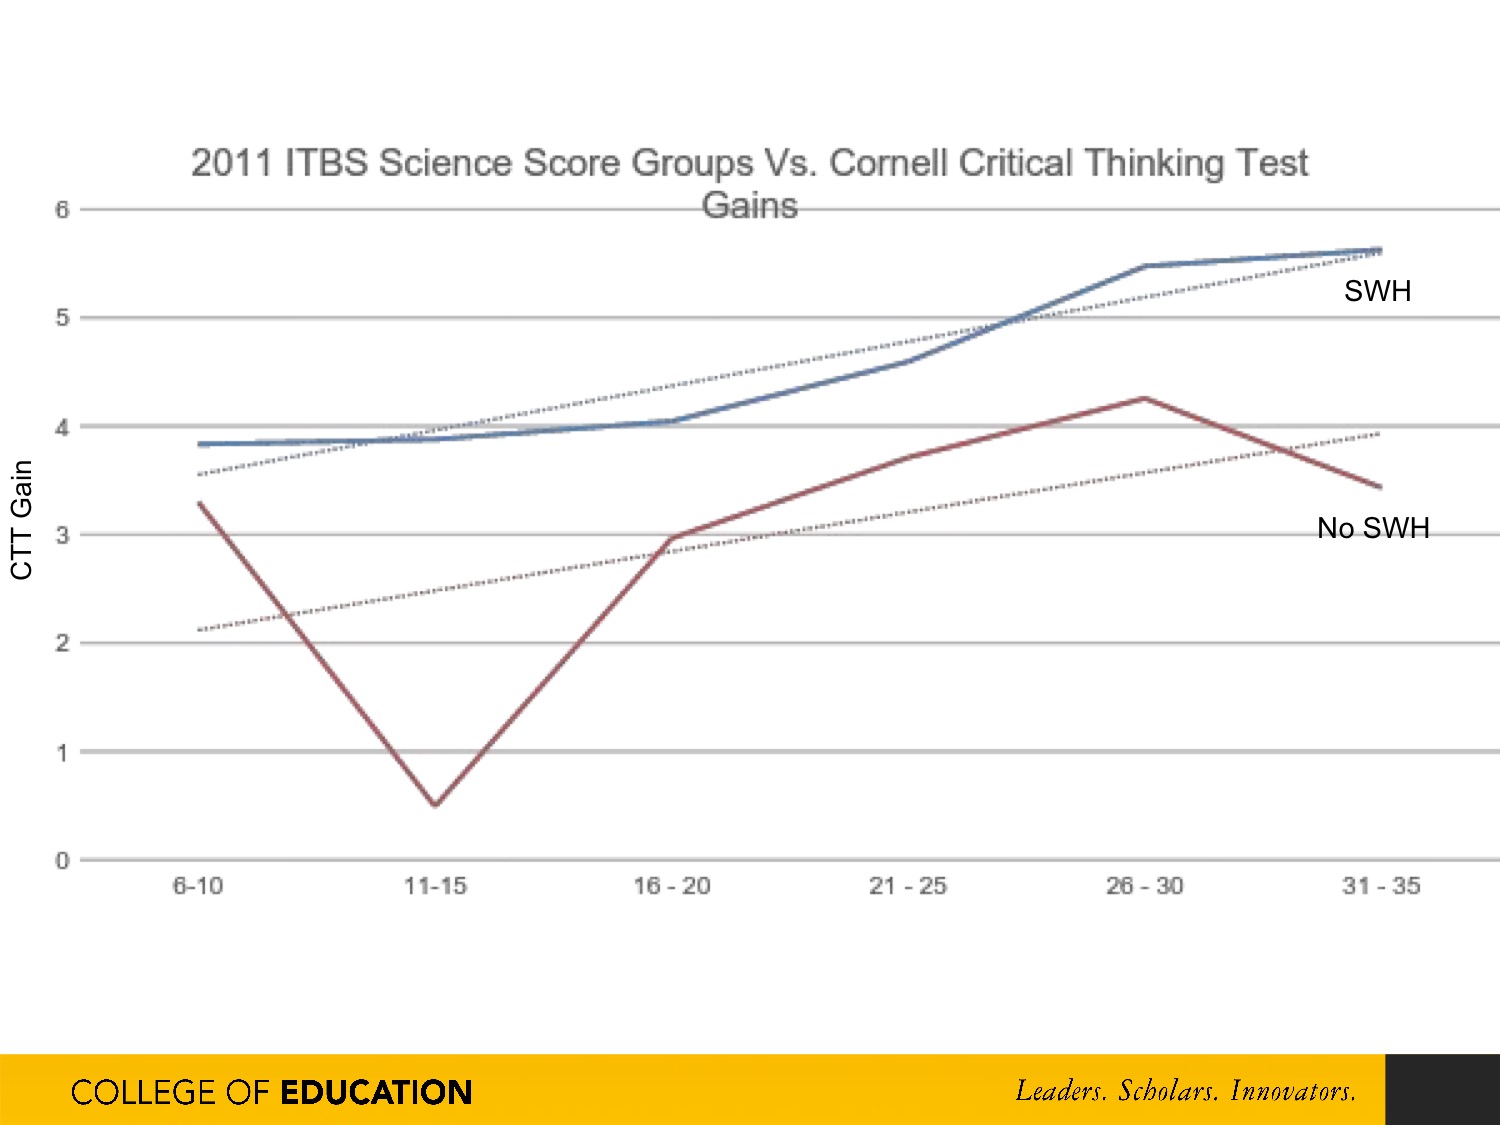
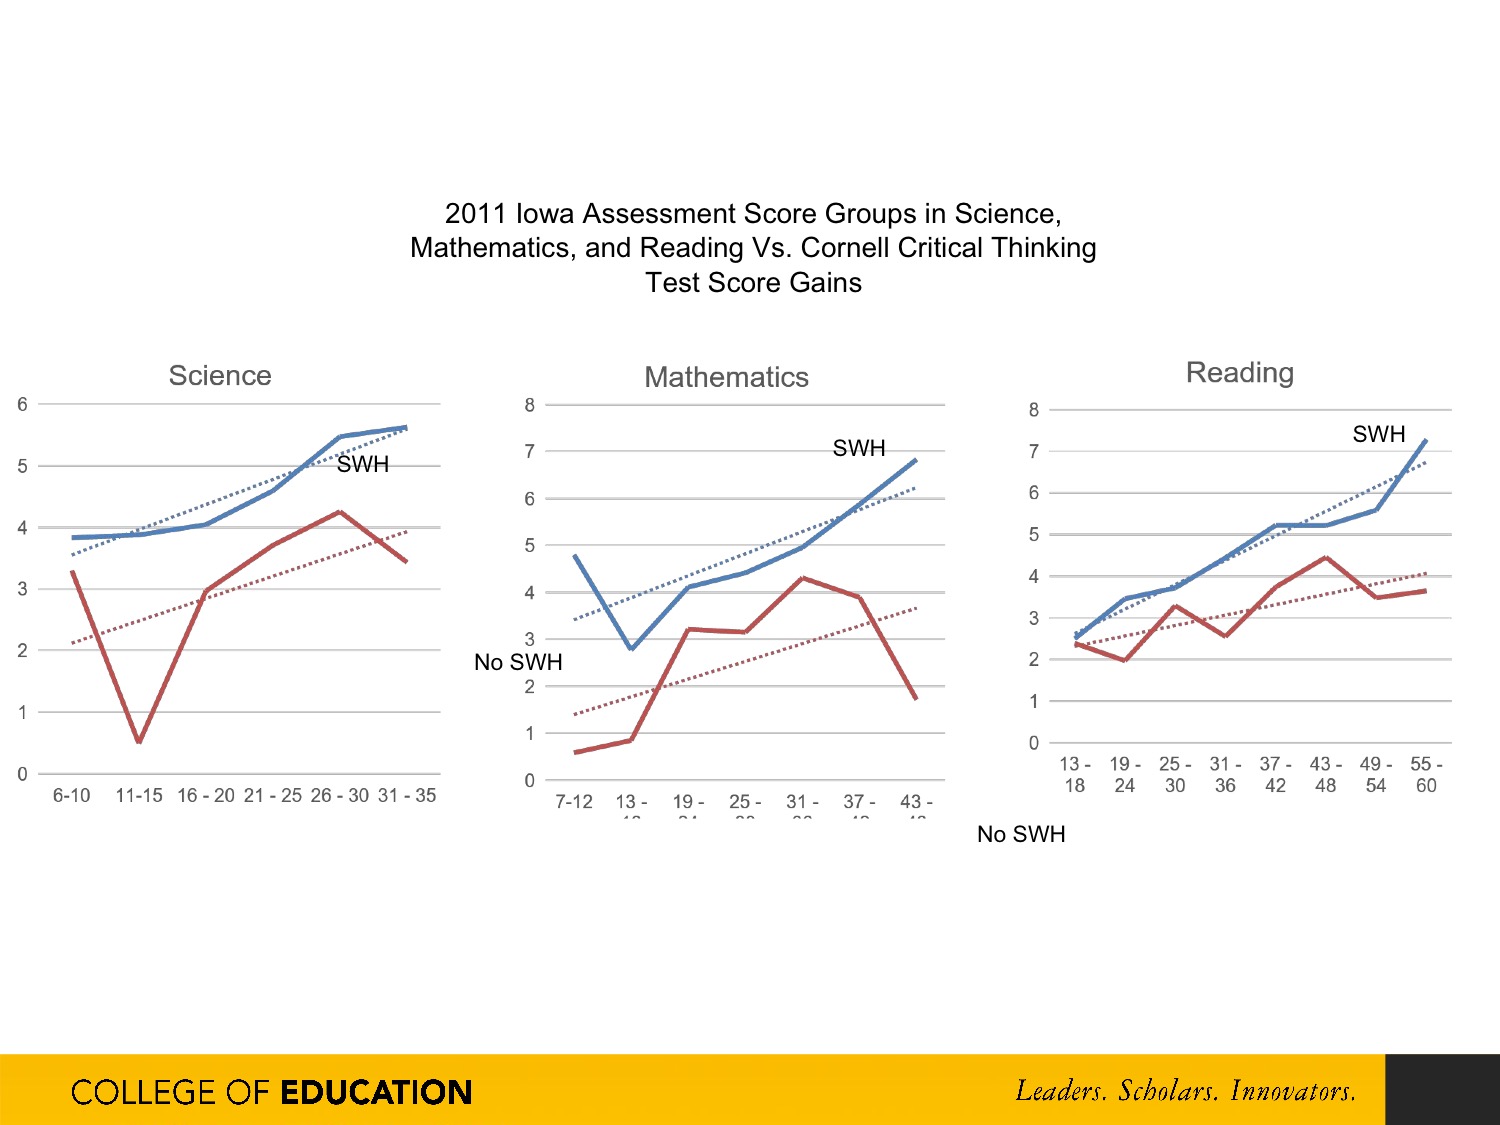
This chart plots gains on the Cornell Critical Thinking test vs Science achievement scores on the Iowa Assessments (IA) test. The IA scores are grouped.
This chart plots gains on the Cornell Critical Thinking test vs Mathematics achievement scores on the Iowa Assessments (IA) test. The IA scores are grouped.
This chart plots gains on the Cornell Critical Thinking test vs Reading scores on the Iowa Assessments (IA) test. The IA scores are grouped.
These charts show the general trend that the more SWH students' critical thinking skills increased, the better they scored on the Iowa Assessments tests in all 3 content areas.
This is not the case with students in traditional science classrooms.